

Labour Practices and Decent Work Responsibility
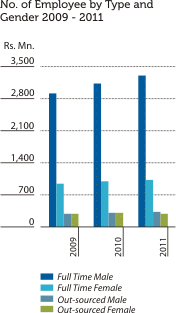
The graph below depicts the growth in number of employees during 2009-2011 analysed by gender.
Employment Type: Full-Time, Part-Time and Outsourced
The Bank did not obtain the services of part-time employees during 2009 to 2011. The percentage of full-time employees and out-sourced employees remained unchanged over the three-year period 2009 to 2011, although the total numbers grew proportionately as shown below:| Employment Type | No. of Employees | Composition of Employees % | ||||
| 2011 | 2010 | 2009 | 2011 | 2010 | 2009 | |
| Full-Time Employees | ||||||
| Male | 3,305 | 3,130 | 2,916 | 76.35 | 75.92 | 75.50 |
| Female | 1,024 | 993 | 946 | 23.65 | 24.08 | 24.50 |
| Total | 4,329 | 4,123 | 3,862 | 100.00 | 100.00 | 100.00 |
| Outsourced Employees | ||||||
| Male | 330 | 308 | 286 | 53.66 | 50.41 | 49.57 |
| Female | 285 | 303 | 291 | 46.34 | 49.59 | 50.43 |
| Total | 615 | 611 | 577 | 100.00 | 100.00 | 100.00 |
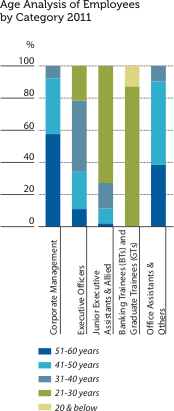
Age Analysis of Employees as at December 31 |
||||||||||||||||
| Category | Corporate Management | Executive Officers | Junior Executive Assistants & Allied | Banking Trainees (BTs) and Graduate Trainees (GTs) | Office Assistants & Others | Total
2011 |
Total
2010 |
Total
2009 |
||||||||
| Male | Female | Male | Female | Male | Female | Male | Female | Male | Female | Male | Female | Male | Female | Male | Female | |
| 51-60 years | 13 | 2 | 151 | 33 | 20 | 18 | – | – | 47 | – | 231 | 53 | 232 | 47 | 218 | 38 |
| 41-50 years | 8 | 1 | 239 | 151 | 32 | 138 | – | – | 63 | – | 342 | 290 | 314 | 261 | 308 | 240 |
| 31-40 years | 2 | – | 570 | 172 | 181 | 111 | 1 | – | 12 | – | 766 | 283 | 658 | 295 | 592 | 317 |
| 21-30 years | – | – | 289 | 72 | 1,139 | 208 | 465 | 107 | – | – | 1,893 | 387 | 1,831 | 375 | 1,771 | 346 |
| 20 & below | – | – | – | – | – | – | 73 | 11 | – | – | 73 | 11 | 95 | 15 | 27 | 5 |
| Total | 23 | 3 | 1,249 | 428 | 1,372 | 475 | 539 | 118 | 122 | – | 3,305 | 1,024 | 3,130 | 993 | 2,916 | 946 |
Service Analysis of Employees as at December 31 |
||||||||||||||||
| Category | Corporate Management | Executive Officers | Junior Executive Assistants & Allied | Banking Trainees (BTs) and Graduate Trainees (GTs) | Office Assistants & Others | Total
2011 |
Total
2010 |
Total
2009 |
||||||||
| Male | Female | Male | Female | Male | Female | Male | Female | Male | Female | Male | Female | Male | Female | Male | Female | |
| Above 20 years | 15 | 3 | 294 | 135 | 40 | 76 | – | – | 83 | – | 432 | 214 | 400 | 181 | 388 | 161 |
| 16-20 years | – | – | 209 | 108 | 32 | 100 | – | – | 38 | – | 279 | 208 | 310 | 233 | 284 | 245 |
| 11-15 years | 1 | – | 153 | 37 | 34 | 47 | – | – | 1 | – | 189 | 84 | 211 | 96 | 258 | 110 |
| 6-10 years | – | – | 289 | 64 | 234 | 72 | – | – | – | – | 523 | 136 | 397 | 127 | 128 | 40 |
| Below 5 years | 7 | – | 304 | 84 | 1,032 | 180 | 539 | 118 | – | – | 1,882 | 382 | 1,812 | 356 | 1,858 | 390 |
| Total | 23 | 3 | 1,249 | 428 | 1,372 | 475 | 539 | 118 | 122 | – | 3,305 | 1,024 | 3,130 | 993 | 2,916 | 946 |


Employment Status
Contract Employees confirmed in service in 2011 increased in number attributable to the growth of the Branch network during the period under review.| Status of Full-Time
Employment as at December 31, |
No. of Employees | Percentage of Employees by Type (%) |
||||
| 2011 | 2010 | 2009 | 2011 | 2010 | 2009 | |
| Confirmed in Service | 3,628 | 3,403 | 3,008 | 83.81 | 82.54 | 77.89 |
| Undergoing Training or on Probation | 701 | 720 | 854 | 16.19 | 17.46 | 22.11 |
| Total | 4,329 | 4,123 | 3,862 | 100.00 | 100.00 | 100.00 |
Employees by Grade
Corporate Management comprised 26 persons in 2011, accounting for less than 1% of the total staff strength. Executive Officers including senior management and Junior Executive Officers accounted for 38.74%, and the balance comprised junior executive assistants, banking trainees and those in office assistant grades. The number of employees of all grades, except office assistants and others, increased over the previous year with the expansion of branch operations.| Category | 2011 | 2010 | 2009 | |||
| No. of Employees |
Percentage |
No. of Employees |
Percentage |
No. of Employees |
Percentage |
|
| Corporate Management | 26 | 0.60 | 24 | 0.58 | 21 | 0.54 |
| Executive Officers | 1,677 | 38.74 | 1,545 | 37.47 | 1,470 | 38.06 |
| Junior Executive Assistants & Allied Grades |
1,847 | 42.67 | 1,808 | 43.85 | 1,563 | 40.47 |
| Banking Trainees | 657 | 15.18 | 611 | 14.82 | 668 | 17.30 |
| Office Assistants & Others | 122 | 2.81 | 135 | 3.28 | 140 | 3.63 |
| Total | 4,329 | 100.00 | 4,123 | 100.00 | 3,862 | 100.00 |