Investor Relations
US$ Income Statement
| Group | Bank | ||||||
| For the year ended December 31, | 2011 | 2010 | Change | 2011 | 2010 | Change | |
| US$ ’000 | US$ ’000 | % | US$ ’000 | US$ ’000 | % | ||
| Income | 398,819 | 373,037 | 6.91 | 398,977 | 373,395 | 6.85 | |
| Interest income | 329,822 | 311,953 | 5.73 | 330,168 | 312,409 | 5.68 | |
| Less: Interest expenses | 172,175 | 164,709 | 4.53 | 172,306 | 164,824 | 4.54 | |
| Net interest income | 157,647 | 147,244 | 7.07 | 157,862 | 147,585 | 6.96 | |
| Foreign exchange profit | 20,365 | 15,656 | 30.08 | 20,365 | 15,656 | 30.08 | |
| Fees and commission income | 33,329 | 28,956 | 15.10 | 33,330 | 28,957 | 15.10 | |
| Other income | 15,303 | 16,472 | (7.10) | 15,114 | 16,373 | (7.69) | |
| Operating Income | 226,644 | 208,328 | 8.79 | 226,671 | 208,571 | 8.68 | |
| Less: Operating Expenses | |||||||
| Personnel expenses | 49,259 | 46,321 | 6.34 | 48,787 | 45,958 | 6.16 | |
| Premises, equipment and establishment expenses | 25,295 | 22,942 | 10.26 | 25,069 | 22,424 | 11.80 | |
| Fees and commission expenses | 3,515 | 2,492 | 41.05 | 3,515 | 2,492 | 41.05 | |
| Provision for staff retirement benefits | 4,545 | 4,305 | 5.57 | 4,519 | 4,290 | 5.34 | |
| Loan losses and provisions | 13,186 | 10,721 | 22.99 | 13,186 | 10,721 | 22.99 | |
| Other overhead expenses | 33,830 | 38,007 | (10.99) | 35,213 | 38,896 | (9.47) | |
| 129,630 | 124,788 | 3.88 | 130,289 | 124,781 | 4.41 | ||
| Profit from operations | 97,014 | 83,540 | 16.13 | 96,382 | 83,790 | 15.03 | |
| Add: Share of profit of Associates | 80 | 97 | (17.53) | – | – | – | |
| Profit before taxation | 97,094 | 83,637 | 16.09 | 96,382 | 83,790 | 15.03 | |
| Less: Income Tax Expense | 26,083 | 34,087 | (23.48) | 25,786 | 34,120 | (24.43) | |
| Net Profit for the year | 71,011 | 49,550 | 43.31 | 70,596 | 49,670 | 42.13 | |
| Attributable to: | |||||||
| Equity holders of the Parent | 71,009 | 49,528 | 43.37 | 70,596 | 49,670 | 42.13 | |
| Minority Interest | 2 | 22 | (90.91) | – | – | – | |
| 71,011 | 49,550 | 43.31 | 70,596 | 49,670 | 42.13 | ||
| Basic Earnings per Share (US$) | 0.09 | 0.06 | 50.00 | 0.09 | 0.06 | 50.00 | |
| Diluted Earnings per Share (US$) | 0.09 | 0.06 | 50.00 | 0.09 | 0.06 | 50.00 | |
| Dividend per Ordinary Share (US$) | – | – | – | 0.05 | 0.06 | (16.67) | |
US DOLLAR ACCOUNTSThe Income Statement and the Balance Sheet in US Dollars are solely for the convenience of shareholders, investors, bankers and other users of Financial Statements and do not form part of the Financial Statements. |
|||||||
US$ Balance Sheet
| Group | Bank | ||||||
| As at December 31, | 2011 | 2010 | Change | 2011 | 2010 | Change | |
| US$ ’000 | US$ ’000 | % | US$ ’000 | US$ ’000 | % | ||
| Assets | |||||||
| Cash and short term funds | 219,608 | 95,362 | 130.29 | 219,397 | 94,937 | 131.10 | |
| Balances with Central Banks | 152,131 | 109,612 | 38.79 | 152,131 | 109,612 | 38.79 | |
| Government Treasury Bills and Bonds | 878,197 | 1,030,041 | (14.74) | 878,197 | 1,030,041 | (14.74) | |
| Securities purchased under resale agreements | 13,526 | 616 | 2,095.78 | 13,526 | 616 | 2,095.78 | |
| Dealing securities | 2,818 | 2,548 | 10.60 | 2,818 | 2,548 | 10.60 | |
| Investment securities | 30,764 | 21,273 | 44.62 | 30,764 | 21,273 | 44.62 | |
| Bills of exchange | 66,145 | 47,585 | 39.00 | 66,145 | 47,585 | 39.00 | |
| Lease receivable | 182,284 | 97,089 | 87.75 | 183,657 | 99,087 | 85.35 | |
| Loans and advances | 2,174,686 | 1,805,100 | 20.47 | 2,174,712 | 1,805,113 | 20.48 | |
| 3,720,159 | 3,209,226 | 15.92 | 3,721,347 | 3,210,812 | 15.90 | ||
| Investments in associates | 747 | 716 | 4.33 | 389 | 399 | (2.51) | |
| Investments in subsidiaries | – | – | – | 2,568 | 3,183 | (19.32) | |
| Interest and fees receivable | 22,378 | 16,946 | 32.05 | 22,378 | 16,946 | 32.05 | |
| Property, plant & equipment | 74,590 | 59,256 | 25.88 | 69,360 | 53,323 | 30.08 | |
| Leasehold property | 993 | 1,031 | (3.69) | 686 | 712 | (3.65) | |
| Other assets | 48,316 | 38,659 | 24.98 | 48,466 | 38,733 | 25.13 | |
| Intangible assets | 4,167 | 3,824 | 8.97 | 4,097 | 3,771 | 8.64 | |
| Total Assets | 3,871,350 | 3,329,658 | 16.27 | 3,869,291 | 3,327,879 | 16.27 | |
| Liabilities | |||||||
| Deposits | 2,793,020 | 2,335,832 | 19.57 | 2,793,521 | 2,336,141 | 19.58 | |
| Borrowings | 174,536 | 129,235 | 35.05 | 174,536 | 129,235 | 35.05 | |
| Securities sold under repurchase agreements | 360,452 | 410,602 | (12.21) | 361,714 | 411,641 | (12.13) | |
| Current tax liabilities | 9,993 | 22,077 | (54.74) | 9,978 | 22,015 | (54.68) | |
| Deferred tax liabilities | 12,014 | 8,927 | 34.58 | 11,645 | 8,026 | 45.09 | |
| Debentures | 8,537 | 19,128 | (55.37) | 8,537 | 19,128 | (55.37) | |
| Other liabilities | 121,592 | 102,246 | 18.92 | 121,405 | 102,214 | 18.78 | |
| Total Liabilities | 3,480,144 | 3,028,047 | 14.93 | 3,481,336 | 3,028,400 | 14.96 | |
| Equity Attributable to Equity Holders’ of the Parent | |||||||
| Stated capital | 144,508 | 97,223 | 48.64 | 144,508 | 97,223 | 48.64 | |
| Statutory reserves | 25,354 | 22,229 | 14.06 | 25,354 | 22,229 | 14.06 | |
| Other reserves | 221,084 | 181,920 | 21.53 | 218,093 | 180,027 | 21.14 | |
| Shareholders’ Funds | 390,946 | 301,372 | 29.72 | 387,955 | 299,479 | 29.54 | |
| Minority interest | 260 | 239 | 8.79 | – | – | – | |
| Total Equity | 391,206 | 301,611 | 29.71 | 387,955 | 299,479 | 29.54 | |
| Total liabilities and equity | 3,871,350 | 3,329,658 | 16.27 | 3,869,291 | 3,327,879 | 16.27 | |
| Commitments and contingencies | 2,057,466 | 1,768,140 | 16.36 | 2,057,466 | 1,768,140 | 16.36 | |
| Net Assets value per ordinary share (US$) | 0.48 | 0.39 | 23.08 | 0.47 | 0.39 | 20.51 | |
Decade at a glance
Bank
| Year Ended
December 31, |
2002 | 2003 | 2004 | 2005 | 2006 | 2007 | 2008 | 2009 | 2010 | 2011 | CAGR | |
| Rs. Mn. | (%) | |||||||||||
| OPERATING RESULTS | ||||||||||||
| Income | 8,364 | 10,059 | 12,290 | 16,100 | 24,470 | 35,223 | 44,115 | 43,741 | 41,522 | 45,484 | 18.68 | |
| Interest income | 6,613 | 7,931 | 9,584 | 13,034 | 19,532 | 30,503 | 37,188 | 35,925 | 34,740 | 37,639 | ||
| Interest expenses | (3,747) | (4,218) | (4,878) | (7,226) | (11,955) | (18,951) | (24,336) | (23,515) | (18,328) | (19,643) | ||
| Foreign exchange profit | 464 | 397 | 874 | 587 | 1,439 | 1,545 | 2,633 | 2,962 | 1,741 | 2,322 | ||
| Commission & other income | 1,097 | 1,731 | 1,832 | 2,479 | 3,499 | 3,175 | 4,294 | 4,854 | 5,041 | 5,523 | ||
| Operating expenses & provisions | (2,902) | (3,887) | (4,908) | (5,232) | (8,301) | (9,567) | (12,259) | (13,035) | (13,876) | (14,853) | ||
| Profit before income tax | 1,525 | 1,954 | 2,504 | 3,642 | 4,214 | 6,705 | 7,520 | 7,191 | 9,318 | 10,988 | 23.56 | |
| Income tax on profit | (321) | (477) | (819) | (1,278) | (2,201) | (2,601) | (3,252) | (2,887) | (3,794) | (2,940) | ||
| Net profit for the year | 1,204 | 1,477 | 1,685 | 2,364 | 2,013 | 4,104 | 4,268 | 4,304 | 5,524 | 8,048 | 23.07 | |
| As at December 31, | ||||||||||||
| ASSETS | ||||||||||||
| Cash and short term funds | 1,835 | 9,002 | 12,136 | 18,663 | 13,739 | 16,208 | 24,115 | 24,057 | 10,557 | 25,011 | ||
| Balances with Central Banks | 3,244 | 5,233 | 6,320 | 9,045 | 12,574 | 11,576 | 10,322 | 11,795 | 12,189 | 17,343 | ||
| Government Treasury Bills and Bonds | 9,436 | 16,530 | 19,900 | 21,218 | 32,065 | 49,863 | 51,633 | 96,671 | 114,541 | 100,114 | ||
| Commercial paper | 1,080 | 546 | 560 | 408 | 423 | – | – | – | – | – | ||
| Securities purchased under re-sale agreements | 832 | 6,184 | 399 | 808 | 4,593 | 3,804 | 3,400 | 5,203 | 68 | 1,542 | ||
| Dealing securities | – | – | 110 | 182 | 145 | 207 | 58 | 81 | 283 | 321 | ||
| Investments held for sale | – | – | – | – | 218 | 205 | – | – | – | – | ||
| Investments held to maturity | 905 | 2,006 | 2,340 | 3,091 | 1,394 | 1,756 | 1,197 | 1,025 | 2,366 | 3,507 | ||
| Bills of Exchange | 2,552 | 2,495 | 2,799 | 2,790 | 3,204 | 3,195 | 3,059 | 2,847 | 5,291 | 7,541 | ||
| Lease receivable | 1,921 | 3,364 | 5,317 | 7,088 | 9,482 | 10,945 | 9,484 | 7,794 | 11,019 | 20,937 | 21.14 | |
| Loans and advances | 47,350 | 60,585 | 82,605 | 108,884 | 137,846 | 160,184 | 167,858 | 161,329 | 200,729 | 247,917 | ||
| 69,155 | 105,945 | 132,486 | 172,177 | 215,683 | 257,943 | 271,126 | 310,802 | 357,043 | 424,233 | |||
| Investments in Associate Companies | 78 | 78 | 109 | 107 | 44 | 44 | 44 | 44 | 44 | 44 | ||
| Investments in Subsidiary Companies | 424 | 429 | 429 | 434 | 434 | 434 | 434 | 279 | 354 | 293 | ||
| Other assets | 2,149 | 2,167 | 2,553 | 4,177 | 4,336 | 5,751 | 5,512 | 6,808 | 6,191 | 8,078 | ||
| Property, Plant & Equipment and Intangible Assets | 1,546 | 1,661 | 2,896 | 3,182 | 3,477 | 3,768 | 4,098 | 4,382 | 6,428 | 8,452 | ||
| Total Assets | 73,352 | 110,280 | 138,473 | 180,077 | 223,974 | 267,940 | 281,214 | 322,315 | 370,060 | 441,100 | 22.25 | |
| LIABILITIES | ||||||||||||
| Deposits from customers | 54,585 | 75,185 | 98,730 | 127,601 | 157,496 | 183,110 | 199,881 | 234,745 | 259,779 | 318,461 | 21.27 | |
| Dividends payable | 118 | 190 | 230 | 230 | 113 | 113 | – | – | – | – | ||
| Borrowings | 4,200 | 5,406 | 9,090 | 13,387 | 18,944 | 18,752 | 13,620 | 11,639 | 14,371 | 19,897 | ||
| Securities sold under re-purchase agreements | 1,938 | 10,580 | 9,050 | 11,389 | 14,330 | 23,342 | 25,075 | 29,905 | 45,774 | 41,235 | ||
| Other liabilities | 4,218 | 4,843 | 3,735 | 6,331 | 9,122 | 10,308 | 10,646 | 12,888 | 12,259 | 15,168 | ||
| Tax payable | 39 | 148 | 483 | 818 | 1,446 | 1,698 | 1,665 | 1,203 | 2,448 | 1,138 | ||
| Debentures | 500 | 2,244 | 3,244 | 4,553 | 6,680 | 6,680 | 4,436 | 3,436 | 2,127 | 973 | ||
| 65,598 | 98,596 | 124,562 | 164,309 | 208,131 | 244,003 | 255,323 | 293,816 | 336,758 | 396,872 | |||
| SHAREHOLDERS’ FUNDS | ||||||||||||
| Share/Stated capital | 1,324 | 2,603 | 2,603 | 3,327 | 2,428 | 10,515 | 10,548 | 10,608 | 10,811 | 16,474 | ||
| Statutory Reserves | 1,009 | 1,009 | 1,009 | 1,421 | 1,429 | 1,634 | 1,896 | 2,164 | 2,472 | 2,890 | ||
| Reserves | 5,421 | 8,072 | 10,299 | 11,020 | 11,986 | 11,788 | 13,447 | 15,727 | 20,019 | 24,863 | ||
| Total Liabilities & Shareholders’ Funds | 73,352 | 110,280 | 138,473 | 180,077 | 223,974 | 267,940 | 281,214 | 322,315 | 370,060 | 441,099 | 22.25 | |
| Commitments and contingencies | 24,082 | 38,158 | 43,942 | 47,154 | 56,418 | 116,212 | 115,809 | 146,072 | 196,617 | 234,551 | ||
| CAGR - Compounded Annual Growth Rate | ||||||||||||
Bank
| 2002 | 2003 | 2004 | 2005 | 2006 | 2007 | 2008 | 2009 | 2010 | 2011 | CAGR | ||
| RATIOS | ||||||||||||
| Return on average Shareholders’ Funds (%) | 16.61 | 15.20 | 13.16 | 15.93 | 12.73 | 20.63 | 17.13 | 15.83 | 17.87 | 20.76 | ||
| Income growth (%) | 1.96 | 20.26 | 22.17 | 31.00 | 51.99 | 43.95 | 25.25 | (0.85) | (5.07) | 9.54 | ||
| Return on average assets (%) | 1.82 | 1.61 | 1.35 | 1.48 | 1.00 | 1.67 | 1.55 | 1.43 | 1.60 | 1.98 | ||
| Rate of dividend (%) | 50.00 | 50.00 | 60.00 | 45.00 | 50.00 | – | – | – | – | – | ||
| Dividend per share (Rs.) | – | – | – | – | – | 7.00 | 7.00 | 7.00 | 7.00 | 6.00 | ||
| Ordinary share dividend cover (times) |
5.20 | 3.70 | 3.48 | 3.34 | 2.54 | 2.29 | 2.42 | 2.46 | 2.09 | 1.64 | ||
| Gross dividends to ordinary shareholders (Rs. Mn.) |
208.95 | 348.25 | 420.00 | 639.36 | 714.00 | 1,743.13 | 1,745.81 | 1,751.47 | 2,642.25 | 4,904.70 | ||
| Advances to deposits and refinance (%) | 92.59 | 86.16 | 89.52 | 90.64 | 92.49 | 91.75 | 87.12 | 70.88 | 80.97 | 84.57 | ||
| Property,Plant & Equipment to Shareholders’ Funds (%) |
19.93 | 14.22 | 20.81 | 20.75 | 21.33 | 15.74 | 15.83 | 15.38 | 19.30 | 19.11 | ||
| Total assets to shareholders’ funds (times) | 9.46 | 9.44 | 9.95 | 11.42 | 14.14 | 11.19 | 10.86 | 11.31 | 11.11 | 9.97 | ||
| Capital funds to liabilities including contingent liabilities (%) |
8.65 | 8.54 | 8.26 | 7.46 | 6.05 | 7.87 | 6.98 | 6.48 | 6.26 | 7.00 | ||
| Cost/Income Ratio (%) | 55.46 | 55.87 | 56.78 | 54.28 | 61.10 | 47.87 | 50.46 | 56.86 | 54.69 | 51.66 | ||
| Liquid assets to liabilities (%) | 27.88 | 23.95 | 23.17 | 24.51 | 22.64 | 24.24 | 24.83 | 38.80 | 29.74 | 26.21 | ||
| (As specified in the Banking Act No. 30 of 1988) |
||||||||||||
| Group Capital Adequacy (%) Tier I |
14.94 | 13.43 | 10.78 | 9.68 | 7.62 | 10.60 | 10.55 | 11.92 | 10.86 | 12.11 | ||
| Tier I & II | 15.07 | 15.46 | 13.16 | 12.08 | 11.58 | 13.71 | 13.13 | 13.93 | 12.26 | 13.01 | ||
| SHARE INFORMATION | ||||||||||||
| Market value of a share (Rs.) | 200.00 | 144.00 | 159.75 | 135.50 | 190.00 | 147.00 | 67.00 | 189.50 | 259.90 | 100.00 | ||
| Earnings per share (Rs.) | 2 | 2 | 2 | 3 | 3 | 5 | 6 | 6 | 7 | 10 | ||
| Price earnings ratio (times) | 5 | 8 | 8 | 9 | 15 | 9 | 4 | 11 | 18 | 10 | ||
| Net assets value per share (Rs.) | 13 | 16 | 19 | 22 | 24 | 30 | 34 | 38 | 44 | 54 | ||
| Earnings yield (%) | 13 | 13 | 13 | 11 | 5 | 11 | 25 | 9 | 6 | 10 | ||
| Dividend payout ratio (%) - Cash | 18 | 27 | 29 | 30 | 39 | 44 | 41 | 41 | 34 | 41 | ||
| Total dividend payout ratio (%) | – | – | – | – | – | – | – | – | 48 | 61 | ||
| OTHER INFORMATION | ||||||||||||
| Number of employees | 2,399 | 2,648 | 2,863 | 3,168 | 3,415 | 3,745 | 4,041 | 4,071 | 4,321 | 4,524 | ||
| Number of delivery points - Sri Lanka |
109 | 116 | 125 | 134 | 150 | 163 | 170 | 172 | 187 | 213 | 8.69 | |
| Number of delivery points - Bangladesh |
– | 4 | 4 | 5 | 7 | 9 | 11 | 15 | 17 | 17 | ||
| Number of Automated Teller Machines |
143 | 166 | 188 | 223 | 278 | 301 | 346 | 368 | 414 | 514 | 16.78 | |
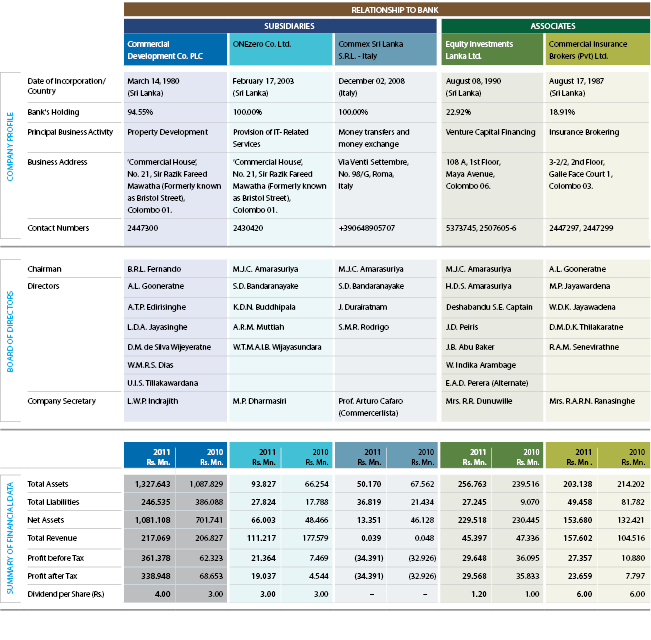
Group Structure