

Investor Relations
Compliance Report on the Contents of Annual Report in terms of the Listing Rules of the colombo stock exchange
We are pleased to inform you that the Bank has complied with all the requirements of the Section 7.6 of the Listing Rules of the Colombo Stock Exchange on the contents of the Annual Report and Accounts of a Listed Entity. The table below provides reference to the relevant Sections of this Annual Report where specified information is found for the convenience of the readers.| Rule No. | Disclosure Requirement | Section/Reference | |
| 7.6 (i) | Names of persons who held the position of Directors during the financial year |
|
|
| 7.6 (ii) | Principal activities of the Bank and its Subsidiaries during the year and any changes therein |
|
|
| 7.6 (iii) | The names and the number of shares held by the 20 largest holders of voting and non-voting shares and the percentage of such shares held |
|
|
| 7.6 (iv) | The public holding percentage |
|
|
| 7.6 (v) | Directors’ and Chief Executive Officer’s holding in shares at the beginning and at the end of the financial year |
|
|
| 7.6 (vi) | Information pertaining to material foreseeable risk factors |
|
|
| 7.6 (vii) | Details of material issues pertaining to employees and industrial relations |
|
|
| 7.6 (viii) | Extents, locations, valuations and the number of buildings of the land holdings and investment properties |
|
|
| 7.6 (ix) | Number of shares representing the stated capital |
|
|
| 7.6 (x) | A distribution schedule of the number of holders in each class of equity securities, and the percentage of their total holdings |
|
|
| 7.6 (xi) | Ratios and market price information: | ||
|
|
||
|
|
||
|
|
||
| 7.6 (xii) | Significant changes in the Bank or its Subsidiaries fixed assets and the market value of land, if the value differs substantially from the book value |
|
|
| 7.6 (xiii) | Details of funds raised through Public Issues, Rights Issues, and Private Placements during the year |
|
|
| 7.6 (xiv) | Information in respect of Employee Share Option Schemes | ||
|
|
||
|
|
||
| 7.6 (xv) | Disclosures pertaining to Corporate Governance practices in terms of Rules 7.10.3, 7.10.5 c. and 7.10.6 c. of Section 7 of the Listing Rules |
|
|
| 7.6 (xvi) | Disclosures on Related Party Transactions exceeding 10% of the Equity or 5% of the total assets of the Entity as per Audited Financial Statements, whichever is lower |
|
1. Quarterly Performance - 2011 Compared to 2010
Summary of the Income Statements
| 2011 | 2010 | ||||||||||
| 1st Quarter 31-Mar. | 2nd Quarter 30-Jun. | 3rd Quarter 30-Sep. | 4th Quarter 31-Dec. | Total | 1st Quarter 31-Mar. | 2nd Quarter 30-Jun. | 3rd Quarter 30-Sep. | 4th Quarter 31-Dec. | Total | ||
| Rs. Mn. | Rs. Mn. | Rs. Mn. | Rs. Mn. | Rs. Mn. | Rs. Mn. | Rs. Mn. | Rs. Mn. | Rs. Mn. | Rs. Mn. | ||
| Group | |||||||||||
| Net Interest Income | 4,321.8 | 4,498.3 | 4,578.3 | 4,573.3 | 17,971.7 | 3,573.8 | 3,819.2 | 4,312.2 | 4,668.3 | 16,373.5 | |
| Non-Interest Income | 1,771.5 | 1,735.1 | 1,883.6 | 2,475.5 | 7,865.7 | 1,443.7 | 1,534.1 | 1,761.2 | 2,053.6 | 6,792.6 | |
| Less: Operating Expenses | 3,125.7 | 3,435.0 | 3,482.6 | 4,734.6 | 14,777.9 | 3,113.8 | 3,220.4 | 3,569.9 | 3,972.4 | 13,876.5 | |
| Profit from Operations | 2,967.6 | 2,798.4 | 2,979.3 | 2,314.2 | 11,059.5 | 1,903.7 | 2,132.9 | 2,503.5 | 2,749.5 | 9,289.6 | |
| Add: Share of Profit of Associate Companies |
5.7 | 2.6 | 1.1 | (0.3) | 9.1 | 1.2 | 0.7 | 5.3 | 3.6 | 10.8 | |
| Profit before Taxation | 2,973.3 | 2,801.0 | 2,980.4 | 2,313.9 | 11,068.6 | 1,904.9 | 2,133.6 | 2,508.8 | 2,753.1 | 9,300.4 | |
| Less: Income Tax Expense | 908.0 | 824.2 | 915.1 | 326.2 | 2,973.5 | 797.0 | 927.5 | 1,087.0 | 979.0 | 3,790.5 | |
| Profit after Taxation | 2,065.3 | 1,976.8 | 2,065.3 | 1,987.7 | 8,095.1 | 1,107.9 | 1,206.1 | 1,421.8 | 1,774.1 | 5,509.9 | |
| Quarterly Profit as a % of the Profit after Tax |
25.5 | 24.4 | 25.5 | 24.6 | 100.0 | 20.1 | 21.9 | 25.8 | 32.2 | 100.0 | |
| Cumulate Quarterly Profit as a % of the Profit after Tax | 25.5 | 49.9 | 75.4 | 100.0 | 20.1 | 42.0 | 67.8 | 100.0 | |||
| Bank | |||||||||||
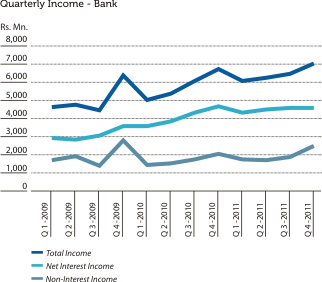
| Net Interest Income | 4,329.9 | 4,505.6 | 4,584.0 | 4,576.7 | 17,996.2 | 3,583.4 | 3,829.0 | 4,322.0 | 4,677.0 | 16,411.4 | |
| Non-Interest Income | 1,763.6 | 1,725.3 | 1,873.0 | 2,482.3 | 7,844.2 | 1,436.5 | 1,535.9 | 1,753.4 | 2,055.8 | 6,781.6 | |
| Less: Operating Expenses | 3,133.7 | 3,441.1 | 3,489.7 | 4,788.5 | 14,853.0 | 3,128.1 | 3,232.0 | 3,581.1 | 3,934.5 | 13,875.7 | |
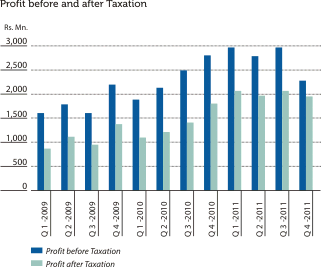
| Profit before Taxation | 2,959.8 | 2,789.8 | 2,967.3 | 2,270.5 | 10,987.4 | 1,891.8 | 2,132.9 | 2,494.3 | 2,798.3 | 9,317.3 | |
| Less: Income Tax Expense | 899.3 | 816.2 | 904.6 | 319.5 | 2,939.6 | 790.4 | 920.7 | 1,080.4 | 1,002.6 | 3,794.1 | |
| Profit after Taxation | 2,060.5 | 1,973.6 | 2,062.7 | 1,951.0 | 8,047.8 | 1,101.4 | 1,212.2 | 1,413.9 | 1,795.7 | 5,523.2 | |
| Quarterly Profit as a % of the Profit after Tax |
25.6 | 24.5 | 25.6 | 24.2 | 100.0 | 19.9 | 21.9 | 25.6 | 32.6 | 100.0 | |
| Cumulate Quarterly Profit as a % of the Profit after Tax | 25.6 | 50.1 | 75.8 | 100.0 | 19.9 | 41.9 | 67.5 | 100.0 | |||
Summary of the Balance Sheets
| 2011 | 2010 | ||||||||
| As at 31-March |
As at 30-June |
As at 30-Sep. |
As at 31-Dec. |
As at 31-March |
As at 30-June |
As at 30-Sep. |
As at 31-Dec. |
||
| Rs. Mn. | Rs. Mn. | Rs. Mn. | Rs. Mn. | Rs. Mn. | Rs. Mn. | Rs. Mn. | Rs. Mn. | ||
| Group | |||||||||
| Net Loans & Advances | 224,455.1 | 232,685.9 | 256,981.8 | 276,235.2 | 172,220.1 | 174,793.3 | 192,915.7 | 216,814.9 | |
| Investments | 123,314.5 | 118,889.5 | 115,099.6 | 105,569.9 | 116,617.6 | 127,007.8 | 129,941.2 | 117,337.6 | |
| Other Assets | 46,989.1 | 46,158.6 | 49,341.1 | 59,528.8 | 45,725.3 | 36,371.0 | 41,757.4 | 36,105.4 | |
| 394,758.7 | 397,734.0 | 421,422.5 | 441,333.9 | 334,563.0 | 338,172.1 | 364,614.3 | 370,257.9 | ||
| Deposits | 274,532.2 | 287,724.7 | 302,401.5 | 318,404.3 | 241,340.3 | 242,241.3 | 252,561.7 | 259,744.6 | |
| Other Liabilities | 85,515.7 | 73,438.1 | 75,576.5 | 78,332.3 | 63,319.4 | 65,791.3 | 80,531.3 | 76,974.2 | |
| Shareholders’ Funds | 34,710.8 | 36,571.2 | 43,444.5 | 44,597.3 | 29,903.3 | 30,139.5 | 31,521.3 | 33,539.1 | |
| 394,758.7 | 397,734.0 | 421,422.5 | 441,333.9 | 334,563.0 | 338,172.1 | 364,614.3 | 370,257.9 | ||
| Bank | |||||||||
| Net Loans & Advances | 224,664.6 | 232,879.9 | 257,160.2 | 276,394.7 | 172,449.8 | 175,066.1 | 193,158.7 | 217,038.5 | |
| Investments | 123,629.5 | 119,202.7 | 115,413.4 | 105,821.8 | 116,867.4 | 127,258.0 | 130,186.6 | 117,656.3 | |
| Other Assets | 46,278.4 | 45,472.3 | 48,684.9 | 58,882.8 | 45,006.1 | 35,619.0 | 41,036.6 | 35,365.3 | |
| 394,572.5 | 397,554.9 | 421,258.5 | 441,099.3 | 334,323.3 | 337,943.1 | 364,381.9 | 370,060.1 | ||
| Deposits | 274,572.1 | 287,826.5 | 302,483.0 | 318,461.4 | 241,382.0 | 242,269.0 | 252,617.4 | 259,778.9 | |
| Other Liabilities | 85,534.6 | 73,405.7 | 75,578.7 | 78,411.2 | 63,292.3 | 65,782.2 | 80,498.7 | 76,979.2 | |
| Shareholders’ Funds | 34,465.8 | 36,322.7 | 43,196.8 | 44,226.7 | 29,649.0 | 29,891.9 | 31,265.8 | 33,302.0 | |
| 394,572.5 | 397,554.9 | 421,258.5 | 441,099.3 | 334,323.3 | 337,943.1 | 364,381.9 | 370,060.1 | ||