Investor Relations
2. Stock Exchange Listing
The following securities of the Bank are listed on the main board of the Colombo Stock Exchange (CSE):| Shares | Debentures | |
| Fixed Rate | Floating Rate | |
| Ordinary Voting Shares |
December 2006/13 | December 2006/13 |
| Ordinary Non-Voting Shares |
December 2006/16 | December 2006/16 |
The unaudited Interim Financial Statements for the first three quarters of 2011 were submitted to the CSE within 45 days from the respective quarter ends as required by the Rule No. 7.4 (a) (i) of the Listing Rules of the CSE. (The Bank duly complied with this requirement for 2010).
The unaudited Interim Financial Statements for the fourth quarter of 2011 will be submitted to the CSE on or before February 29, 2012, as required by the Rule No. 7.4 (a) (i) of the Listing Rules of the CSE. (The Bank duly complied with this requirement for 2010).
The Audited Income Statement for the year ended December 31, 2011 and the Audited Balance Sheet as at December 31, 2011 will be submitted to the Colombo Stock Exchange within three months from the Balance Sheet date, which is well with in the required deadline as required by the Rule No. 7.5 (a) of the Listing Rules of the CSE (The Bank duly complied with this requirement for 2010).
The Stock Exchange ticker symbol for Commercial Bank’s shares/debentures is ‘COMB’.
Details of trading activities are published in most daily newspapers, generally under the above abbreviation.
3. The names, number and percentage of shares helD by Twenty largest Shareholders (As per Rule No. 7.6 (iii) of the listing rules of the Cse)
| As at December 31, | 2011 | 2010 (*) | ||||
| Ordinary Voting Shares | No. of Shares | % | No. of Shares | % | ||
| 1. | DFCC Bank A/C 1 | 113,985,956 | 14.90 | 52,853,674 | 14.96 | |
| 2. | Employees’ Provident Fund | 71,714,288 | 9.37 | 16,605,950 | 4.70 | |
| 3. | HSBC Intl. Nominees Ltd. - SSBT - International Finance Corporation GNA-C61V | 57,924,400 | 7.57 | 33,800,002 | 9.57 | |
| 4. | SBI Ven Holdings Pte Ltd. | 54,257,040 | 7.09 | 35,147,227 | 9.95 | |
| 5. | Sri Lanka Insurance Corporation Ltd. - Life Fund | 38,867,290 | 5.08 | 18,022,212 | 5.10 | |
| 6. | Sri Lanka Insurance Corporation Ltd. - General Fund | 33,420,522 | 4.37 | 15,496,623 | 4.39 | |
| 7. | HSBC Intl. Nominees Ltd. - SSBT - Janus Overseas Fund | 32,497,940 | 4.25 | 16,162,100 | 4.57 | |
| 8. | Mr. Y.S.H.I.K. Silva | 23,935,294 | 3.13 | 11,078,063 | 3.14 | |
| 9. | Distilleries Company of Sri Lanka PLC | 16,765,490 | 2.19 | 7,773,921 | 2.20 | |
| 10. | HSBC Intl. Nominees Ltd. - BPSS LUX - Aberdeen Global - Asian Smaller Companies Fund | 15,788,166 | 2.06 | 7,520,750 | 2.13 | |
| 11. | HSBC Intl. Nominees Ltd. - SSBT - Janus Aspen Series Overseas Portfolio | 14,734,068 | 1.93 | 7,323,050 | 2.07 | |
| 12. | HSBC Intl. Nominees Ltd. - SSBT - Aberdeen Institutional Commingled Fund, LLC | 11,682,656 | 1.53 | 3,828,761 | 1.08 | |
| 13. | HSBC Intl. Nominees Ltd. - BPSS LUX - Aberdeen Global - Asia Pacific Equity Fund | 10,375,310 | 1.36 | 5,331,280 | 1.51 | |
| 14. | HSBC Intl. Nominees Ltd. - BPSS LUX - Aberdeen Global - Emerging Markets Smaller Companies Fund | 10,141,886 | 1.33 | 3,290,200 | 0.93 | |
| 15. | Mrs. L.E.M. Yaseen | 9,999,600 | 1.31 | 1,000,000 | 0.28 | |
| 16. | Mercantile Investments PLC | 9,900,066 | 1.29 | 3,900,000 | 1.10 | |
| 17. | HSBC Intl. Nominees Ltd. - SSBT - South Asia Portfolio | 9,239,174 | 1.21 | 4,369,300 | 1.24 | |
| 18. | Mr. S.E. Captain | 9,223,900 | 1.21 | 1,306,855 | 0.37 | |
| 19. | HSBC Intl. Nominees Ltd. - BP2S LONDON - Aberdeen Asia Smaller Companies Investment Trust | 6,448,328 | 0.84 | 2,989,999 | 0.85 | |
| 20. | BNY - CF Ruffer Investment Fund : CF Ruffer Pacific Fund | 5,963,086 | 0.78 | 2,765,000 | 0.78 | |
| Sub Total | 556,864,460 | 72.80 | 250,564,967 | 70.92 | ||
| Other Shareholders | 208,220,860 | 27.20 | 102,740,420 | 29.08 | ||
| Total | 765,085,320 | 100.00 | 353,305,387 | 100.00 | ||
As per Rule No. 7.6 (iv) of the Listing Rules of the CSE, percentage of public holding of voting shares as at December 31, 2011 was 84.62% (84.37% as at December 31, 2010).
* Comparative shareholdings as at December 31, 2010 of the twenty largest shareholders as at December 31, 2011.
| As at December 31, | 2011 | 2010 (*) | ||||
| Ordinary Non-Voting Shares | No. of Shares | % | No. of Shares | % | ||
| 1. | Employees' Trust Fund Board | 2,113,930 | 4.04 | 714,255 | 2.95 | |
| 2. | GF Capital Global Ltd. | 1,334,930 | 2.55 | 616,449 | 2.55 | |
| 3. | HINL - JPMCB - Butterfield Trust (Bermuda) Ltd. | 1,299,310 | 2.48 | 600,000 | 2.48 | |
| 4. | J.B. Cocoshell (Pvt) Ltd. | 1,287,392 | 2.46 | – | – | |
| 5. | Deutsche Bank AG - National Equity Fund | 1,095,752 | 2.09 | 593,300 | 2.45 | |
| 6. | Deutsche Bank AG as Trustee for Namal Aquity Value Fund | 1,082,756 | 2.07 | 589,200 | 2.44 | |
| 7. | Mr. J.D. Bandaranayake | 1,002,976 | 1.92 | 402,113 | 1.66 | |
| 8. | M.J.F. Exports Ltd. | 895,796 | 1.71 | 413,665 | 1.71 | |
| 9. | Union Assurance PLC/NO - 01 A/C | 824,846 | 1.58 | 206,050 | 0.85 | |
| 10. | Mr. S.E. Captain | 701,514 | 1.34 | 750 | – | |
| 11. | Mr. M.A. Yaseen | 600,054 | 1.15 | – | – | |
| 12. | Mr. M.F. Hashim | 588,692 | 1.12 | 269,587 | 1.11 | |
| 13. | Mr J.G. De Mel | 558,166 | 1.07 | 243,899 | 1.01 | |
| 14. | Dr. A.K.A. Jayawardene | 500,972 | 0.96 | 272,031 | 1.12 | |
| 15. | Mr. M.J.C. Amarasuriya | 497,614 | 0.95 | 227,821 | 0.94 | |
| 16. | Saboor Chatoor (Pvt) Ltd. | 471,000 | 0.90 | 214,000 | 0.88 | |
| 17. | The Planters Association of Ceylon as Trustee of Ceylon Planters Provident Society | 460,604 | 0.88 | 82,700 | 0.34 | |
| 18. | Bank of Ceylon A/C Ceybank Century Growth Fund | 448,810 | 0.86 | 98,100 | 0.41 | |
| 19. | Akbar Brothers (Pvt) Ltd. A/C No 1 | 418,770 | 0.80 | 17,824 | 0.07 | |
| 20. | Mr. G.R. Mallawaaratchy & Mrs. B.G.P. Mallawaaratchy (Joint) | 416,552 | 0.80 | 190,650 | 0.79 | |
| Sub Total | 16,600,436 | 31.73 | 5,752,394 | 23.76 | ||
| Other Shareholders | 35,764,410 | 68.27 | 18,428,801 | 76.24 | ||
| Total | 52,364,846 | 100.00 | 24,181,195 | 100.00 | ||
As per Rule No. 7.6 (iv) of the Listing Rules of the CSE, percentage of public holding of non-voting shares as at December 31, 2011 was 99.71% (98.77% as at December 31, 2010).
* Comparative shareholdings as at December 31, 2010 of the twenty largest shareholders as at December 31, 2011.
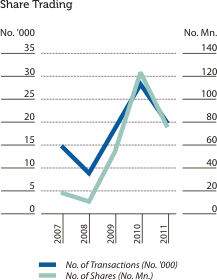
4. Information on Share Trading
| Ordinary Shares - Voting Shares |
Ordinary Shares - Non-Voting Shares |
||||
| 2011 | 2010 | 2011 | 2010 | ||
| Number of Transactions | 12,857 | 19,620 | 7,211 | 8,614 | |
| Number of Shares Traded | 64,123,760 | 113,377,065 | 12,911,700 | 9,799,700 | |
| Value of Shares Traded (Rs. Bn.) | 12.48 | 26.37 | 1.50 | 1.56 | |
5. Information on ratios, Market Prices and credit ratings
(As per Rule No. 7.6 (xi) of the Colombo Stock Exchange)
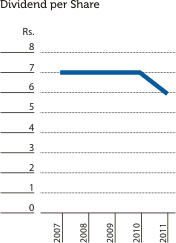
(a) Information on Ratios - Shares
| 2011 | 2010 | ||
| Dividend per Share (Rs.) | - Cash | 4.00 | 5.00 |
| - Issue and Allotment of Shares |
2.00 | 2.00 | |
| Dividend Payout Ratio (%) | - Cash | 41.45 | 34.33 |
| - Total | 64.48 | 47.90 | |
| Net Assets Value per Share (Rs.) | 54.10 | 43.53 | |
(b) Market Prices - Shares
| Ordinary Shares - Voting | Ordinary Shares - Non-Voting | ||||
| 2011 | 2010 | 2011 | 2010 | ||
| Rs. | Rs. | Rs. | Rs. | ||
| Highest Price (*) | 284.00 | 295.00 | 200.00 | 226.00 | |
| Date of the Highest Price | (25.01.2011) | (04.10.2010) | (15.08.2011) | (15.06.2010) | |
| Lowest Price | 97.00 | 175.00 | 69.10 | 75.00 | |
| Date of the Lowest Price | (25.11.2011) | (07.07.2010) | (16.12.2011) | (21.09.2010) | |
| Year end Price | 100.00 | 259.90 | 74.50 | 162.00 | |
(*) The highest prices indicated above for 2011 are based on share prices before the Rights Issue in September 2011 and share split made in
September 2011.(c) Information on Ratios, Market Prices and Interest Rates on DebenturesPlease refer item No. 15 under Investor Relations.(d) Credit Ratings - Shares and DebenturesThe Bank’s credit rating, AA(lka) was reaffirmed by Fitch Ratings Lanka Ltd. in 2011.Consequently, the credit rating of the Bank’s subordinated debentures, AA-(lka) too reaffirmed in 2011. The Bank’s Bangladesh Operation’s credit rating was upgraded to AAA from AA+ by Credit Rating Information Services Ltd. in 2011. |
|||||
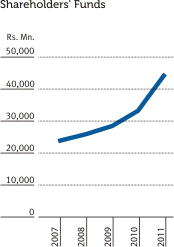
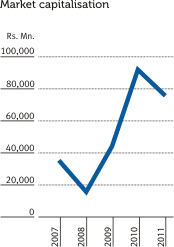
6. Information on Shareholders’ Funds and Market Capitalisation
| As at December 31, |
Shareholders’ Funds | Com Bank Market Capitalisation* | Total Market Capitalisation of the CSE | Com Bank’s Market Capitalisation as a % of CSE Market Capitalisation | Com Bank’s Market Capitalisation Ranking |
| Rs. Mn. | Rs. Mn. | Rs. Mn. | |||
| 2007 | 23,937 | 34,234 | 820,652 | 4.17 | 4 |
| 2008 | 25,891 | 15,630 | 488,813 | 3.20 | 4 |
| 2009 | 28,499 | 44,309 | 1,092,138 | 4.06 | 5 |
| 2010 | 33,302 | 91,824 | 2,280,874 | 4.03 | 4 |
| 2011 | 44,227 | 76,509 | 2,268,854 | 3.37 | 6 |
| * Commercial Bank’s Market Capitalisation includes only Voting Ordinary Shares. | |||||