

Financial Review
Summary of Quarterly Performance
| Bank | 3 Months ended | 6 Months ended | 9 Months ended | Year ended |
| March 31, 2011 Rs. Mn. |
June 30, 2011 Rs. Mn. |
September 30, 2011 Rs. Mn. |
December 31, 2011 Rs. Mn. |
|
| Profit before Tax | 2,959.8 | 5,749.6 | 8,716.9 | 10,987.3 |
| Quarterly Profit before Tax | 2,959.8 | 2,789.8 | 2,967.3 | 2,270.4 |
| Profit after Tax | 2,060.5 | 4,034.1 | 6,096.8 | 8,047.7 |
| Quarterly Profit after Tax | 2,060.5 | 1,973.6 | 2,062.7 | 1,950.9 |
| Deposits | 274,572.1 | 287,826.5 | 302,483.0 | 318,461.4 |
| Quarterly Growth in Deposits | 14,793.2 | 13,254.4 | 14,656.5 | 15,978.4 |
| Net Advances | 224,664.6 | 232,879.9 | 257,160.2 | 276,394.5 |
| Quarterly Growth in Net Advances | 7,626.1 | 8,215.3 | 24,280.3 | 19,234.5 |
| ROA (before Tax) (%) | 3.14 | 3.02 | 2.95 | 2.71 |
| ROE (%) | 24.66 | 23.37 | 21.31 | 20.76 |
| Cost/Income (%) | 51.38 | 51.50 | 51.56 | 51.66 |
| Interest Margin (%) | 4.59 | 4.64 | 4.53 | 4.44 |
| NPA Ratio (Net) (%) | 3.26 | 2.75 | 2.76 | 2.08 |
| Capital Adequacy | ||||
| Tier I Capital (%) | 10.31 | 11.63 | 12.02 | 12.11 |
| Total Capital (%) | 11.58 | 12.82 | 13.07 | 13.01 |
| Liquid Assets Ratio | ||||
| DBU (%) | 30.13 | 27.98 | 26.31 | 25.70 |
| OBC (%) | 27.49 | 27.51 | 29.97 | 27.77 |
Quarterly Performance
As detailed earlier, the Bank recorded moderate growth in loans and advances in the first half of the year. This was largely attributable to the relatively high liquidity in most of the banks which carried over from 2010. As the table above illustrates, the liquid asset ratio of the DBU, which climbed as high as 30.13% on March 31, declined to 25.70% as of December 31. The 2.75% non-performing loans ratio recorded on June 30, 2011 was reduced to2.08% by year-end, mainly due to the Bank’s accelerated credit growth in the second half of the year. In spite of these challenges, deposits recorded steady growth throughout the year. Return on equity was 20.76% as of December 31, 2011, down from a high of 24.66% at the end of the first quarter. This was largely due to the rights issue of shares during the third quarter. As a consequence, the total capital adequacy ratio had improved to 13.01% by year-end.
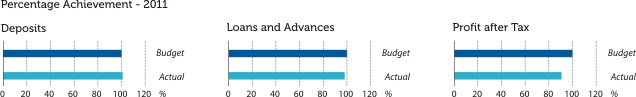
Summary of the Bank's Performance
| 2011 | |||
| BANK | Actual Rs. Mn. |
Budget Rs. Mn. |
2010 Actual Rs. Mn. |
| Total Revenue | 45,483.4 | 45,995.9 | 41,521.5 |
| Profit before Tax | 10,987.3 | 12,005.4 | 9,317.4 |
| Profit after Tax | 8,047.7 | 8,853.6 | 5,523.3 |
| Deposits | 318,461.4 | 318,825.3 | 259,778.9 |
| Loans and Advances | 283,343.6 | 287,548.8 | 224,020.2 |
| ROA (before Tax) (%) | 2.71 | 2.87 | 2.69 |
| ROE (%) | 20.76 | 25.99 | 17.87 |
| Cost/Income (%) | 51.66 | 51.11 | 54.69 |
| NPA Ratio (Net) (%) | 2.08 | 2.70 | 2.78 |
| Capital Adequacy | |||
| Tier I Capital (%) | 12.11 | 10.01 | 10.87 |
| Total capital (%) | 13.01 | 11.10 | 12.27 |
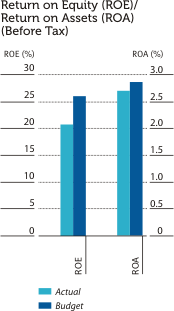
The Bank achieved many of the ambitious targets set at the beginning of the year, despite additional specific provisions made on a prudential basis during the year.