

Economic Responsibility
Value Addition and Distribution
Shows how wealth was generated and distributed among the key stakeholders of the Bank, taking into account the amounts retained and reinvested for the replacement of assets and improvements to its operations.| 2011 | 2010 | 2009 | 2008 | 2007 | ||||||
| Rs. Mn. | % | Rs. Mn. | % | Rs. Mn. | % | Rs. Mn. | % | Rs. Mn. | % | |
| Value Added | ||||||||||
| Income from Banking Services |
45,029 | 40,809 | 42,736 | 43,236 | 34,782 | |||||
| Cost of Services | (24,302) | (21,648) | (26,436) | (26,805) | (20,098) | |||||
| Value Added by Banking Services |
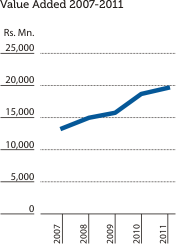
20,727 | 105.33 | 19,161 | 102.56 | 16,300 | 103.35 | 16,431 | 109.30 | 14,684 | 110.02 |
| Non-Banking Income | 455 | 2.31 | 713 | 3.82 | 1,005 | 6.37 | 879 | 5.85 | 440 | 3.30 |
| Loan Losses and Provisions |
(1,503) | (7.64) | (1,192) | (6.38) | (1,534) | (9.72) | (2,278) | (15.15) | (1,777) | (13.32) |
| Total | 19,679 | 100.00 | 18,682 | 100.00 | 15,771 | 100.00 | 15,032 | 100.00 | 13,347 | 100.00 |
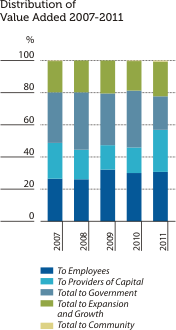
| Distribution of Value Added | ||||||||||
| To Employees | ||||||||||
| Salaries and Other Benefits |
6,077 | 30.87 | 5,588 | 29.90 | 5,081 | 32.22 | 3,926 | 26.12 | 3,539 | 26.51 |
| To Providers of Capital | ||||||||||
| Dividends to Shareholders | 4,905 | 2,642 | 1,749 | 1,786 | 1,855 | |||||
| Interest to Debenture holders |
228 | 374 | 626 | 978 | 1,105 | |||||
| Total To Providers of Capital |
5,133 | 26.09 | 3,016 | 16.15 | 2,375 | 15.06 | 2,764 | 18.39 | 2,960 | 22.18 |
| To Government | ||||||||||
| Income Tax | 2,635 | 3,865 | 2,796 | 3,261 | 2,629 | |||||
| Financial VAT | 1,523 | 2,709 | 2,264 | 2,091 | 1,552 | |||||
| Debits Tax | 5 | 12 | 8 | 9 | 6 | |||||
| Total to Government | 4,163 | 21.16 | 6,586 | 35.26 | 5,068 | 32.14 | 5,361 | 35.67 | 4,187 | 31.37 |
| To Expansion and Growth | ||||||||||
| Retained Profit | 3.143 | 2,881 | 2,556 | 2,482 | 2,248 | |||||
| Depreciation | 748 | 623 | 577 | 483 | 411 | |||||
| Deferred Taxation | 304 | (71) | 91 | (9) | (28) | |||||
| Total to Expansion and Growth |
4,195 | 21.32 | 3,433 | 18.38 | 3,224 | 20.44 | 2,956 | 19.67 | 2,631 | 19.71 |
| To Community Investments | ||||||||||
| Donations | 110 | 59 | 23 | 25 | 30 | |||||
| Total to Community | 110 | 0.56 | 59 | 0.31 | 23 | 0.14 | 25 | 0.15 | 30 | 0.23 |
| Total Distributed | 19,679 | 100.00 | 18,682 | 100.00 | 15,771 | 100.00 | 15,032 | 100.00 | 13,347 | 100.00 |
Note: Donations shown under ‘community investments’ include the contribution made by the Bank to its Corporate Social Responsibility Trust (CSR Trust), amounting to Rs. 80 Mn. (Rs. 55 Mn. in 2010). A summary of the activities of the CSR Trust appears in the Section on 'CSR in 2011' of this Sustainability Supplement.
Impact on Performance Due to Climate Change
Generally banks are not directly exposed to risks arising from climate change. However, adverse climatic conditions could impact on the operations and profits of banks indirectly through its financial exposure to sectors to which they have provided financial assistance such as agriculture, fisheries and exports – all of which are vulnerable to climate change. To mitigate the impact of losses arising from such lending, our Bank has set up internal limits for various sectors. A summary of significant concentrations of credit risk by industry appears in Note 20.6 to the Financial Statements.Despite its limited exposure, the Bank does pursue a defined climate change strategy that includes the following commitments:
- Developing products and services that support GHG emission reductions and helping customers to closely monitor those activities with environmental impact. Further, the Bank has continued to provide financial assistance to its customers operating in areas such as wind power generation and energy saving. The cumulative value of such financial accommodation granted as at end 2011 stood at Rs. 1.425 Bn. The Bank intends to support such industries in future as well as part of its sustainability effort.
- Encouraging customers to benefit from energy saving initiatives that make their operations more efficient while reducing their carbon footprint. Often, this involves financial support for green initiatives of various kinds.
- Updating the knowledge base of the Bank with regard to climate change and disseminating this knowledge to staff and customers through its designated Social and Environmental Coordinator.
Benefits and Contribution Plans
Defined Benefit Plans
Employees of the Bank benefit from three defined benefit plans, namely:- An unfunded pension scheme for employees who retired before January 1, 1992 and employees whose future service period as of that date was less than ten years;
- A funded pension scheme for those employees who did not accept the restructured pension scheme in 2006; and
- A retirement gratuity scheme as required by statute.
The Bank duly carried out actuarial valuations on these retirement benefit obligations at the end of 2011 with the assistance of a qualified actuary who used the Projected Unit Credit Method (as prescribed in Sri Lanka Accounting Standard No. 16 (Revised 2006) on ‘Employee Benefits’). As the Bank is obliged to make good any shortfall on these funds, arrangements were made to incorporate full provisions in respect of shortfall, if any in the respective funds in the Bank's Financial Statements for 2011. More details in this regard are found in Note M 9 under the Accounting Policies on Defined Benefit Plans in Notes 8, 31 and 38 to the Financial Statements.
Defined Contribution Plans
Employees are also eligible for one or the other of the Bank’s three defined contribution plans, namely:- A funded Pension Scheme for employees who accepted the restructured pension scheme in 2006
- Contributions to the Employees’ Provident Fund (EPF)
- Contributions to the Employees’ Trust Fund (ETF)
More details are found in Note M 10 under the Accounting Policies on Defined Contribution Plans and in Note 7 to the Financial Statements.
The assets of all funded schemes are adequate to cover their respective liabilities. All employees who joined the Bank on or after January 1, 2002 and are in the permanent cadre of the Bank are eligible to participate in the gratuity, EPF and ETF plans only.